|
|
|
|
|
|
|
Figure 9.12
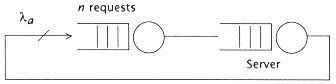
Simplified model. |
|
|
|
|
|
|
|
|
Figure 9.13
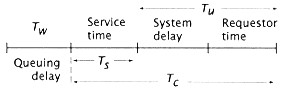
Request-service cycle. |
|
|
|
|
|
|
|
|
As a further simplification, we assume that one of the serial service units (the one with the least capacity) determines the system response. We treat the other service units merely as delay centers. This is usually a reasonable assumption, as queueing delays accumulate at the bottleneck, or most restrictive service unit in a system. We further assume that each of the requestors has an identical Poisson request distribution. We will discuss this assumption later, as some modeling situations allow only a "finite population" of requestsunlike Poissonto be present at any instant. |
|
|
|
|
|
|
|
|
This provides us with a simplified picture of our queueing model (Figure 9.12). |
|
|
|
|
|
|
|
|
Unlike open-queue models, where the request rate is independent of queueing delay, I/O-asymptotic models must recognize the effect of waiting time on request rate. |
|
|
|
|
|
|
|
|
Suppose we have a request-service cycle as shown in Figure 9.13. In an open-queue model, the request rate (l) is independent of the waiting time Tw; that is, for n requestors, |
|
|
|
|
|
|
|
|
where Ts is the service time and Tu is the user time required for the requestor to prepare another request once it receives a response from the server to the prior request. Tu includes delay centers. The sum of Ts and Tu is designated Tc, the cycle time for a request-response in the absence of any waiting time. |
|
|
|
|
|
|
|
|
In closed-loop systems (Figures 9.11 and 9.12), the waiting time Tw directly affects the achieved request rate: |
|
|
|
|
|
|
|
|
Suppose we define the ratio r as |
|
|
|
|
|