|
|
|
| m | r | Tw | TR | | 16 | 0.04 | 0.6 | 35.7 | | 4.7 | 0.12 | 1.8 | 30.7 | | 6.0 | 0.10 | 1.4 | 30.3 | | 8.7 | 0.07 | 1.0 | 29.9 | | 1 | 0.45 | 8.6 | 27.3 | | 2 | 0.23 | 3.2 | 22.9 | | 4 | 0.12 | 1.6 | 23.5 | | 1.5 | 0.35 | 6.3 | 28.0 | | 3 | 0.18 | 2.7 | 28.7 |
|
|
|
|
|
|
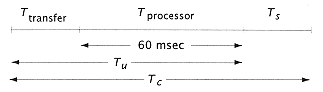
where TR, the total response time, is: |
|
|
|
|
|
|
|
|
Study 9.6 Closed-Queue Study of Concurrent Disk Configurations |
|
|
|
|
|
|
|
|
Now let us repeat study 9.5, but using our closed-queue model. We will assume multiprocessor requestors (n), each with the following timing: |
|
|
|
|
|
|
|
|
For this study, we make an important assumption on the access's behavior on distributed disks. In study 9.5, we assumed that the requests were made uniformly to all physical servers. In this study, we assume that the effective number of servers is the square root of the number of independent server classes (m¢). This presumably adjusts the traffic for access patterns to frequently used files, so that now our model is shown in Figure 9.36. |
|
|
|
|
|
|
|
|
We further assume a more conservative coefficient of variance of c2 = 0.5. We will look at two workloads: |
|
|
|
|
|
|
|
|
1. (As before) 70% 1-block file accesses, 30% accesses uniformly distributed over 216-block files access. |
|
|
|
|
|
|
|
|
2. 30% 1-block file accesses, 70% accesses uniformly distributed over 216-block files access. |
|
|
|
|
|
|
|
|
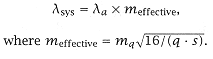
Using Equations 9.8 and 9.10, we can find Tw/Tc and then the la, the achieved request rate per server. The total request-server rate for the system is: |
|
|
|
|
|