|
|
|
|
|
|
|
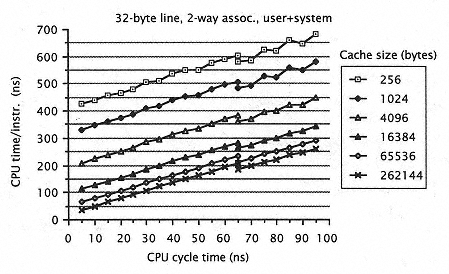
Figure 5.44
CPU time per instruction. |
|
|
|
|
|
|
|
|
2.82 to 2.49. Figure 5.44 shows how CTPI changes with CPU cycle time for different cache sizes. Note the dips that occurred at the 65ns boundary. When the cycle time is below 65 ns but larger than 58 ns, the machine actually performs poorer than when running at 65 ns. In this case, a CPU cycle time that matches the cache access time is preferred. The figure also shows that a change in cache size is more effective in small caches than in large caches. |
|
|
|
|
|
|
|
|
To summarize the results of the preceding study, smaller cycle times require faster technology and more expensive implementations. Larger cycle times, however, require increased cache size, which also contributes significantly to cost. The data presented in Figure 5.42 assume that the processor timing template is invariant as cycle time changes. This generally is not the case, however, as the cache per se rarely determines the cycle time over any broad range of cycle time. Usually, the cache itself can be pipelined, that is, staged so that single access can be achieved in two or three stages. When the access time for the cache was fixed at 65ns, the timing template was modified, i.e., simplified, to allow for one access to the cache for cycle times of 65 ns and above. Below this, the template remains at a two-cycle access. |
|
|
|
|
|
|
|
|
An alternative approach to evaluating the effectiveness of cache is to measure the effective memory access time (Teff.mem.): |
|
|
|
 |
|
|
|
|
Teff.mem. = Tcache + miss rate * Tc.miss, |
|
|
|
|
|