|
|
|
|
|
|
|
The modeling asumption is that the number of items that appear at a particular pipeline stage can be defined as a random variable (q) with mean (Q) and standard deviation (s). Notice that our modeling approach does not recognize the ''history" or sequential nature of items collecting at a pipeline stage. In chapter 6, we will see another modeling approach using queueing theory. Generally, the results of the two modeling approaches are consistent. |
|
|
|
|
|
|
|
|
We assume that q is a random variable describing the actual request size and Q is the mean this distribution, the buffer is of size BF, and the probability of buffer full or overflowed is p. |
|
|
|
|
|
|
|
|
Bound 1 (Chebyshev's Inequality) |
|
|
|
|
|
|
|
|
The probability of buffer full or overflowed (p) is: |
|
|
|
|
|
|
|
|
That is, the probability of a buffer overflow is less than the mean number of requests divided by the buffer size. |
|
|
|
|
|
|
|
|
Bound 2 (Chebyshev's Inequality Corollary) |
|
|
|
|
|
|
|
|
The probability of buffer full or overflowed (p) is: |
|
|
|
|
|
|
|
|
This corollary is a direct result of Chebyshev's Inequality and the definition of variance, since |
|
|
|
|
|
|
|
|
is simply restating the inequality in terms of variance. (B is an arbitrary number.) We rearrange the above and let B = BF - Q to get the corollary. |
|
|
|
|
|
|
|
|
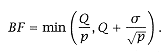
This corollary can be rewritten and solved for BF: |
|
|
|
|
|
|
|
|
We now can use the most favorable BF size: |
|
|
|
|
|
|
|
|
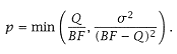
Alternatively, we may know the BF size and wish to determine p: |
|
|
|
|
|